LaTeX templates and examples — Math
Recent
This is a template for preparing manuscripts for submission to the Annals of Mathematics. The original repository, with relevant documentation, can be found here.
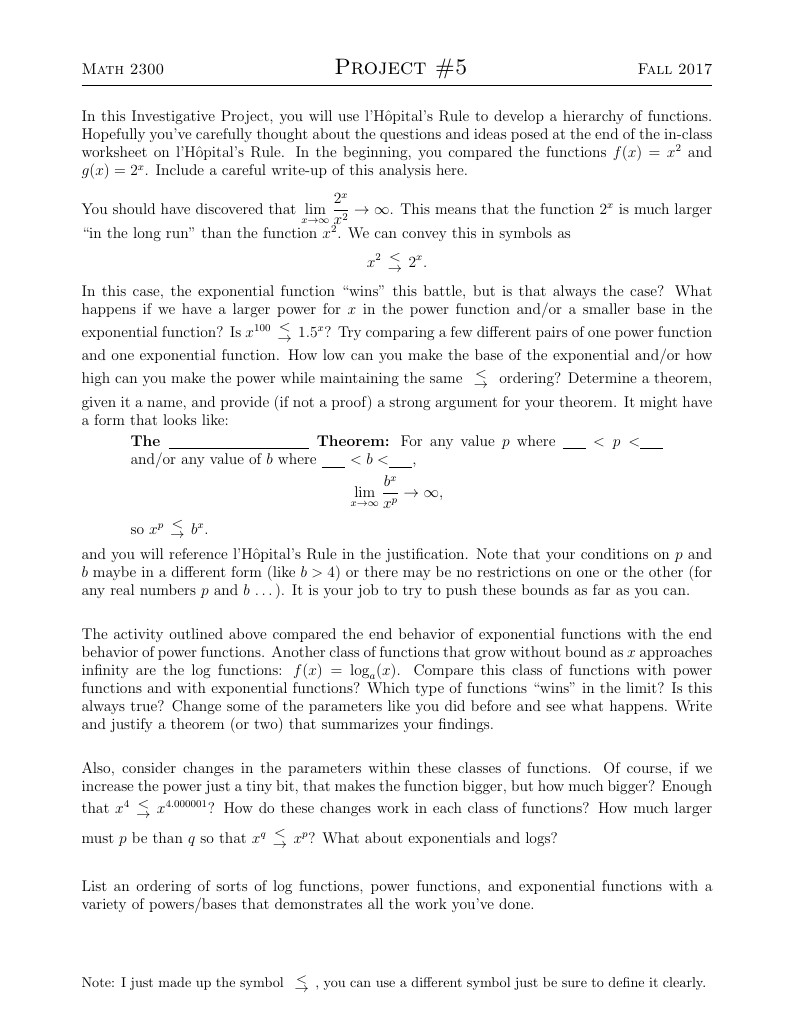
This is the fifth project option for Calculus I during Fall 2017 at Fitchburg State. This project involves ordering types of functions by investigating their limits at infinity.
Based on the paper Sometimes Newton's Method Cycles, we first asked ourselves if there were any Newtonian Method Cycle functions which have non-trivial guesses. We encountered a way to create functions that cycle between a set number of points with any initial, non-trivial guesses when Newton's Method is applied. We exercised these possibilities through the methods of 2-cycles, 3-cycles and 4-cycles. We then generalized these cycles into k-cycles. After generalizing Newton's Method, we found the conditions that skew the cycles into a spiral pattern which will either converge, diverge or become a near-cycle. Once we obtained all this information, we explored additional questions that rose up from our initial exploration of Newton's Method.
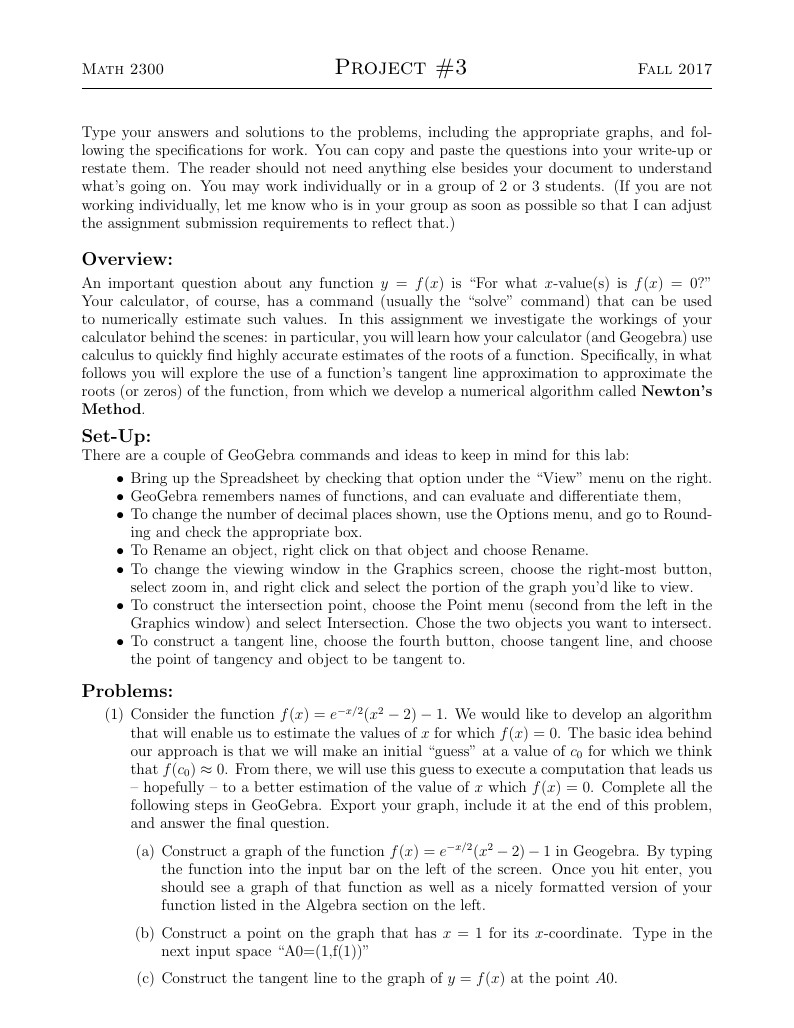
This is a project to develop students' understanding of Newton's Method using the tools available in Geogebra. This project was adapted from a similar project developed by folks at Grand Valley State University. (If any of you see this and would like more specific attributions, please let me know.)
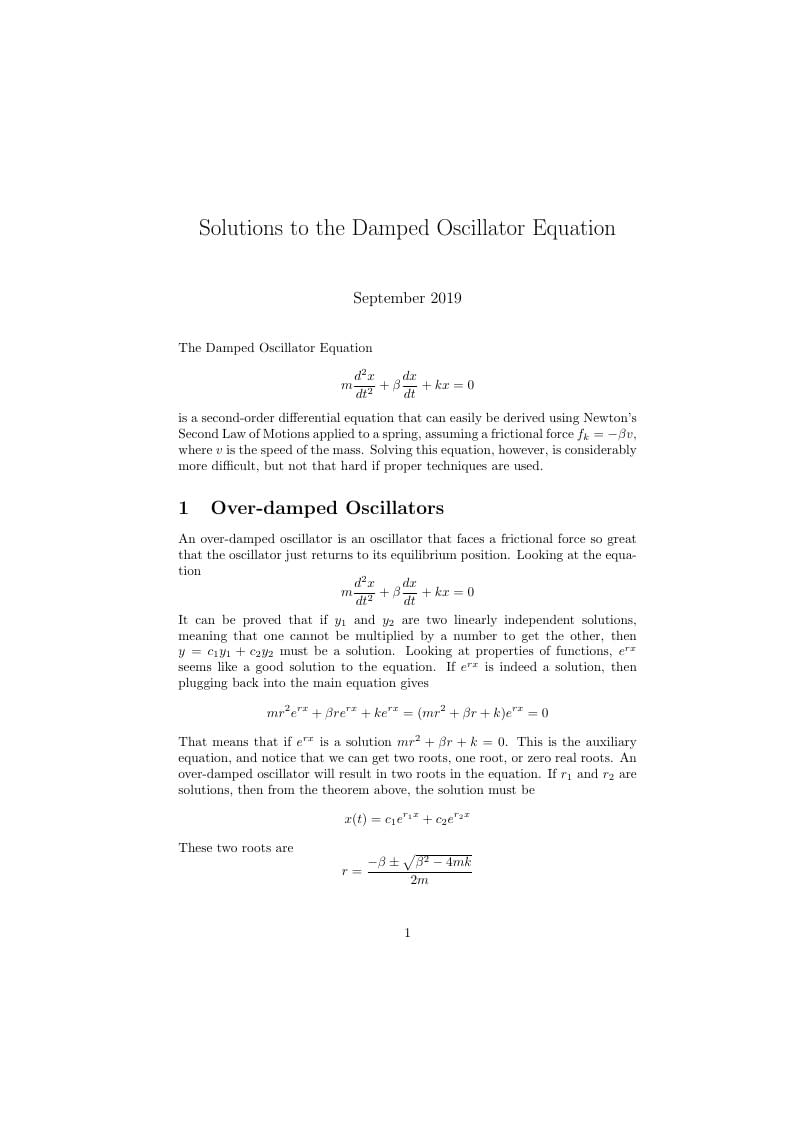
This paper describes the three conditions of damped oscillations and the mathematical formulations of each condition.
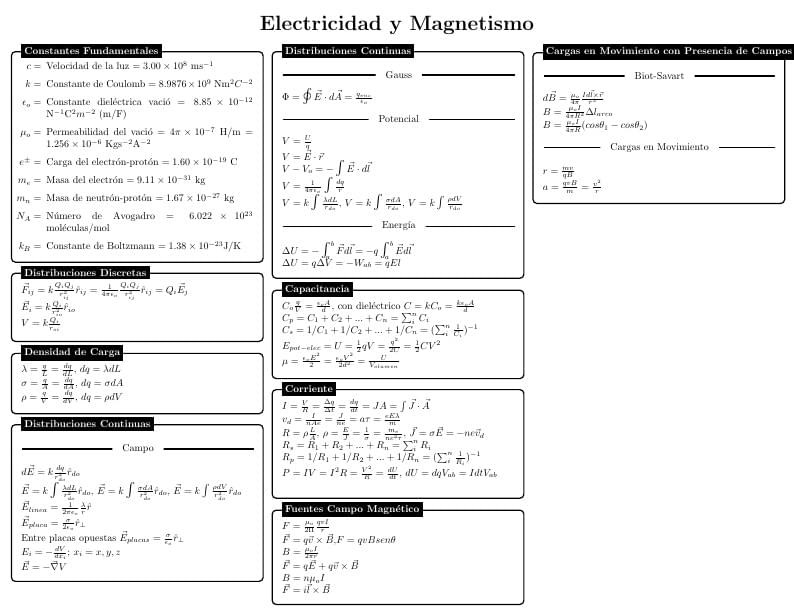
Herramienta para generar hojas de ayuda para Física
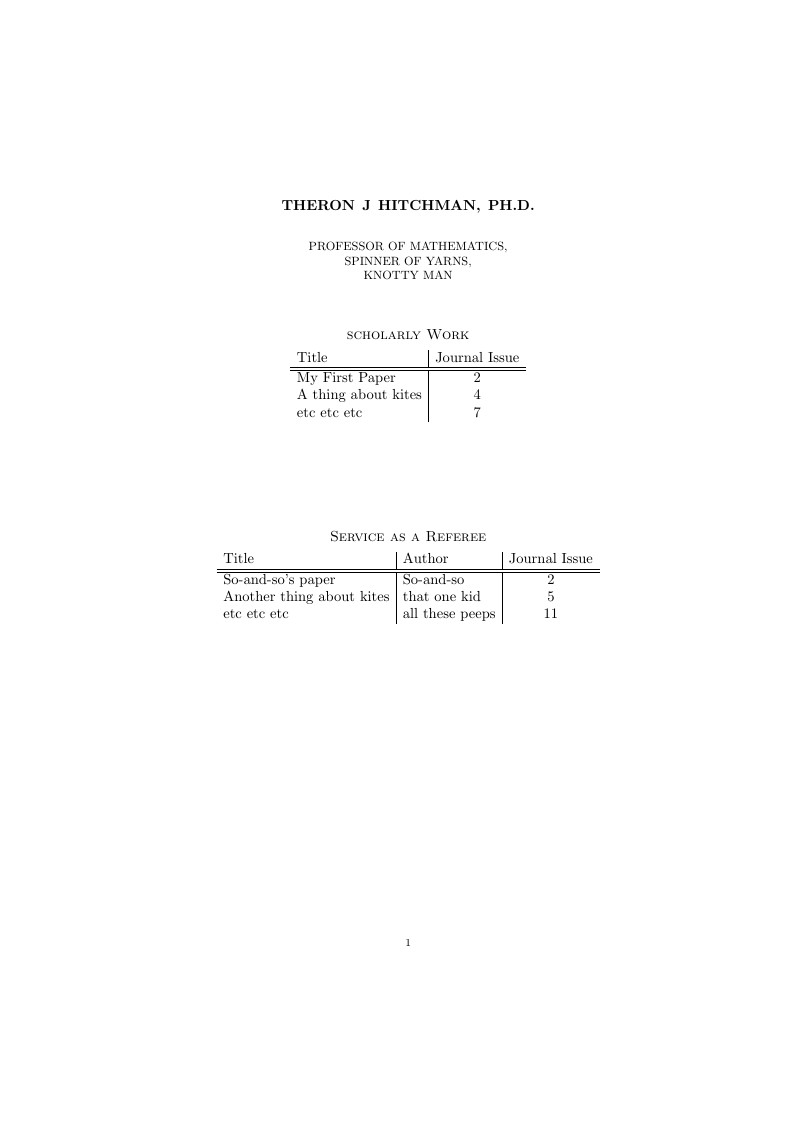
This template is for the final CV assignment in Dr Hitchman's course Math 3600: Euclidean Geometry at University of Northern Iowa
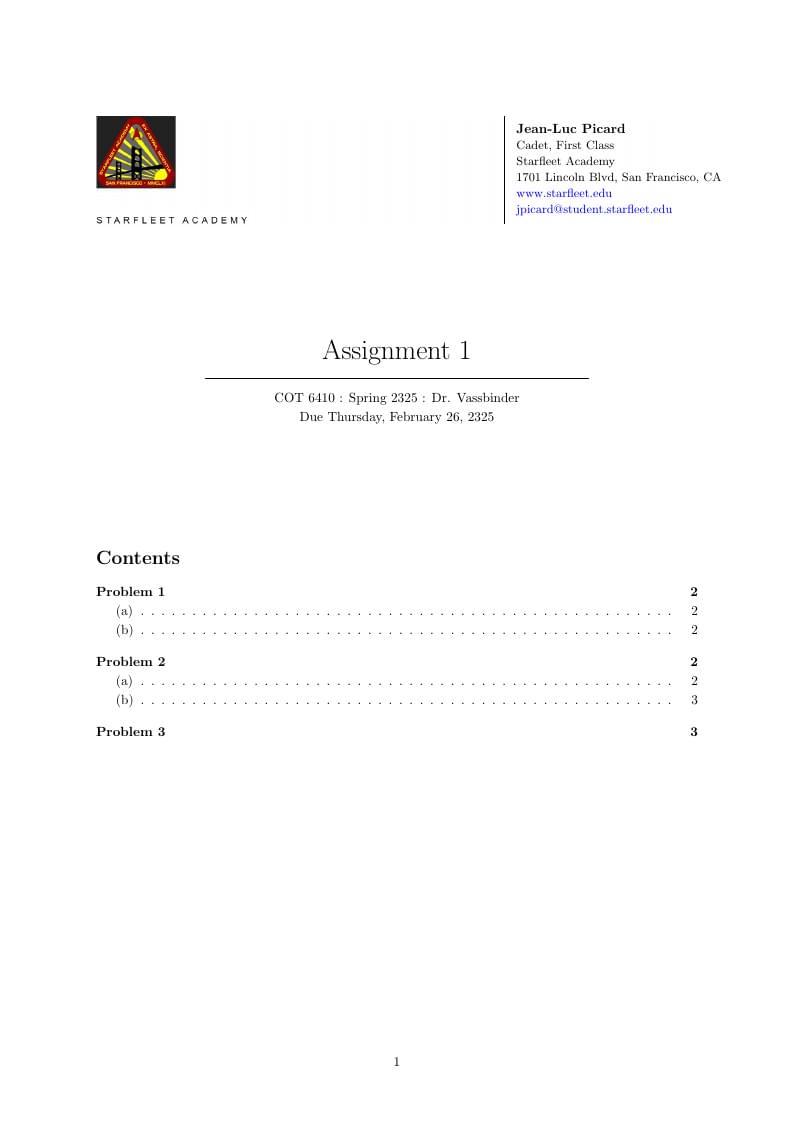
A clean and easy to use LaTeX template for homework / assignments. Applicable at the university level for math and computer science courses. Problems and solutions are neatly organized, can be renamed, and referenced in a brief table of contents. Customizeable author, course, title information. Custom footers highlight sections that span pages.
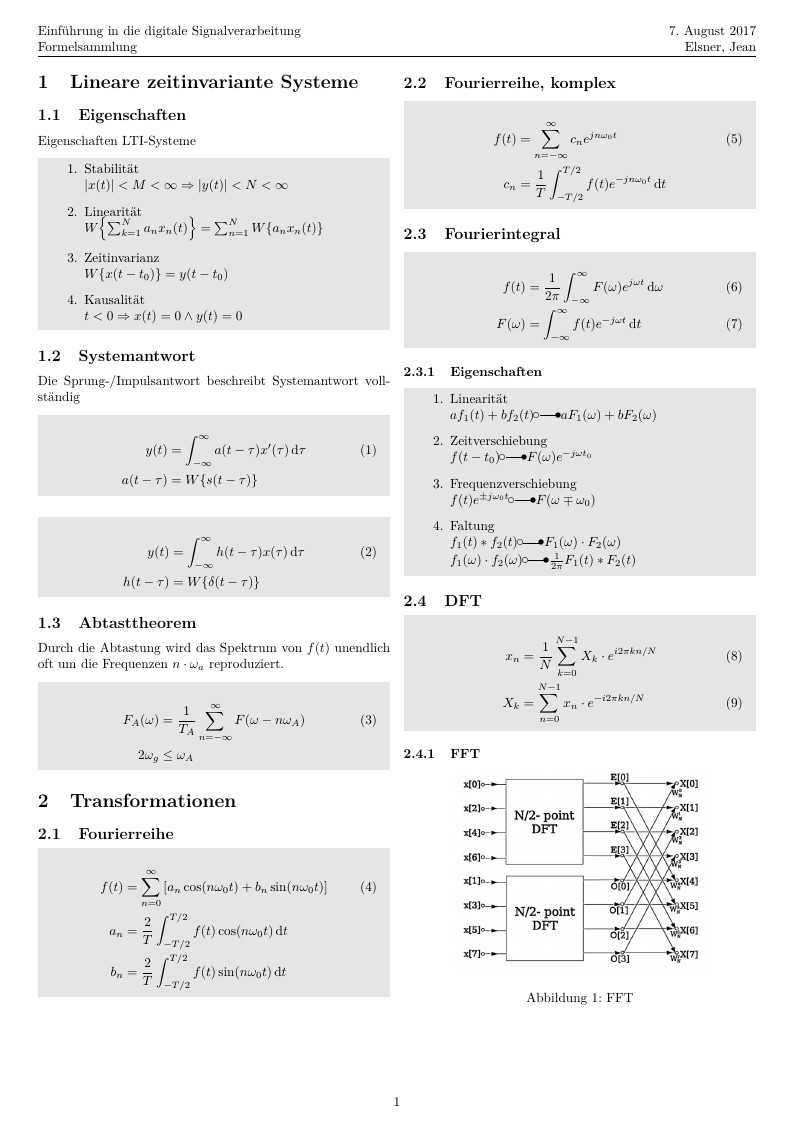
Für [IN2061] Einführung in die digitale Signalvereinbarung an der Technischen Universität München.
\begin
Discover why over 25 million people worldwide trust Overleaf with their work.