overleaf template galleryLaTeX templates and examples — Recent
Discover LaTeX templates and examples to help with everything from writing a journal article to using a specific LaTeX package.
This is a report template for bachelor, master, and PhD students at the Faculty of Sciences of Sfax
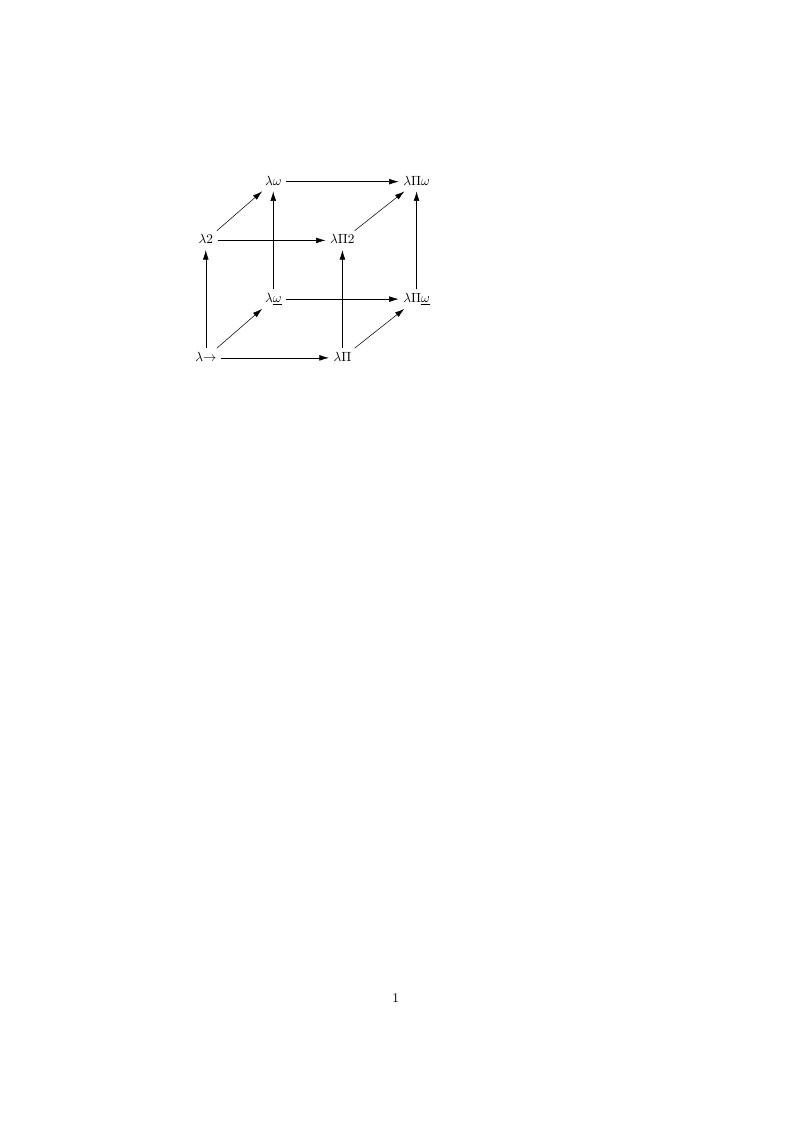
Computer Science. Type theory. Famous Lambda Cube invented by Henk Barendregt.
Classe anglaise pour la rédaction des mémoires, rapports et thèses conformes aux normes de présentation de l'UQAM-Département de mathématiques.
Report template for Praxisprojects @ colaps, UDE

A project report using the LaTeX Template Project Titlepage Modified (v 0.1) by rcx. Original Source of template: http://www.howtotex.com Date: February 2014 This is a title page template which be used for articles & reports. This is the modified version of the original Latex template from aforementioned website.

改了一下北大模板,做了一份北师的模板
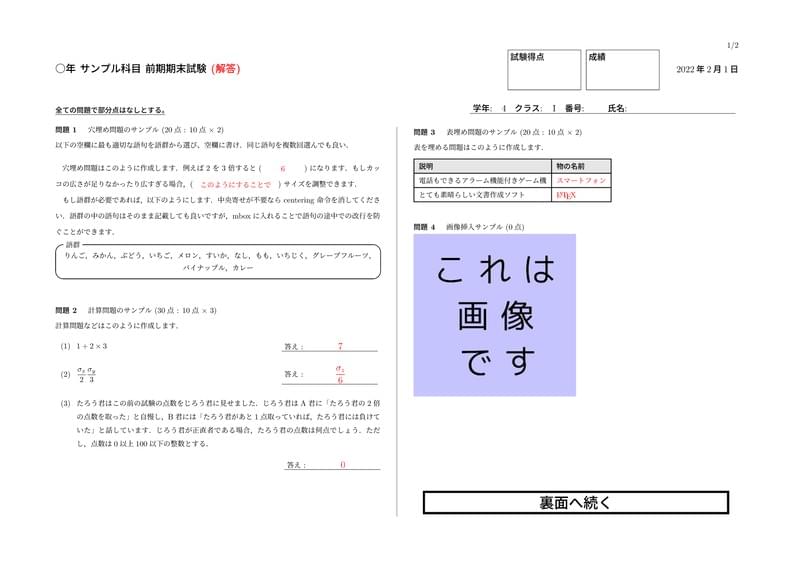
回答を直接書き込むタイプの試験問題用紙を作成できるテンプレートです.
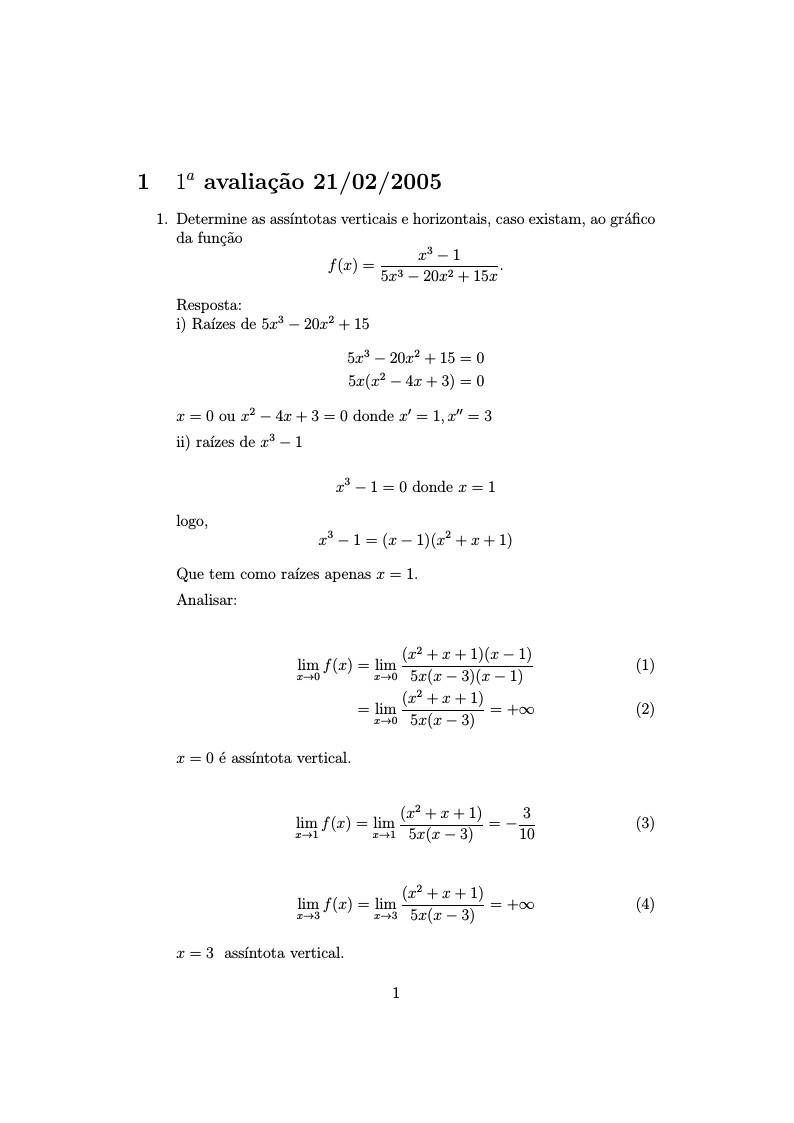
Primeiras questões respondidas do banco de Cálculo 1 da UFAL.
A basic template to make a beamer presentation for UMass Boston.
\begin
Discover why over 25 million people worldwide trust Overleaf with their work.