Psfrag Example
Author:
LianTze Lim
Last Updated:
7 years ago
License:
Creative Commons CC BY 4.0
Abstract:
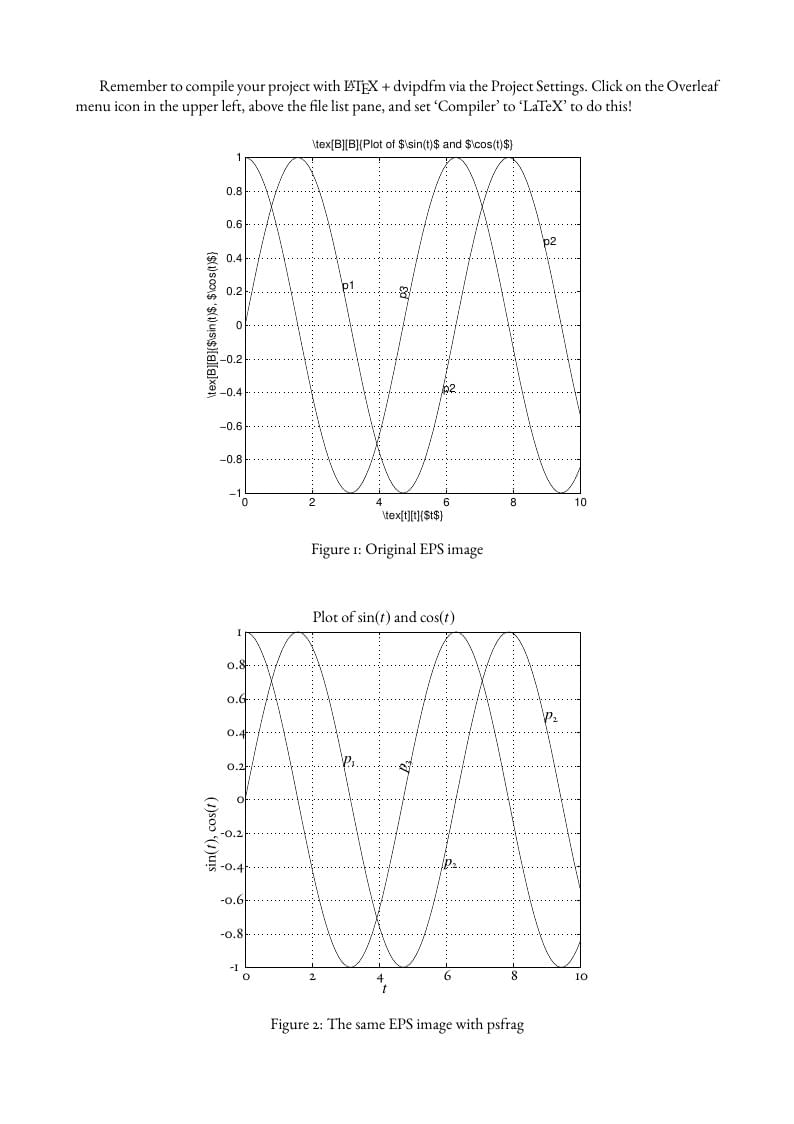
Use the psfrag package to replace strings in EPS images, so that they are typeset with the same body font as your LaTeX document. Note that your project needs to be compiled with the LaTeX dvipdf engine. To configure this, after creating a new project, click on the Overleaf menu icon above the file list panel, and make sure the "Compiler" setting is set to "LaTeX".
(The sample image is taken from the psfrag package.)

\begin
Discover why over 25 million people worldwide trust Overleaf with their work.